Python培训Week4
前言
这节课是公司“学徒计划”训练营Python课程班的第4节课,前3节课主要讲了web框架(Django和原生方式)、selenium自动化测试工具的使用、网络爬虫(Scrapy和原生方式)。
这节课开始,进入课程的主要内容——机器学习部分。
这节课主要是4类python库的使用:
- Numpy 数据处理
- Pandas 读取文件
- Matplotlib 图形化展示
- Scipy高级科学计算库和scikit-learn机器学习库
Numpy
1 | import numpy as np |
运行结果
1 | 1 |
参考array_two:一个数据(矩阵)是一个dataset,其中每行数据是一个sample(类似数据库,一行一个数据),每列是一个feature。
reshape和resize
reshape:为了降低运算复杂度,reshape为低纬度的数据。不改变原始矩阵的形状。
如,3*3的矩阵变为1*9的行。
1 | array_two = np.array( [[1,2,3], [4,5,6],[7,8,9] ]) |
1 | [[1 2 3 4 5 6 7 8 9]] |
1 | 类似的,```array_two.reshape(-1,1)``` 为one feature, multiple samples。不常见,很少有数据只有1个特征值。 |
1 | [[1 2 3 4 5 6 7 8 9]] |
Pandas
使用数据集https://archive.ics.uci.edu/dataset/53/iris
1 | import pandas as pd |
输出如下:
1 | id code name |
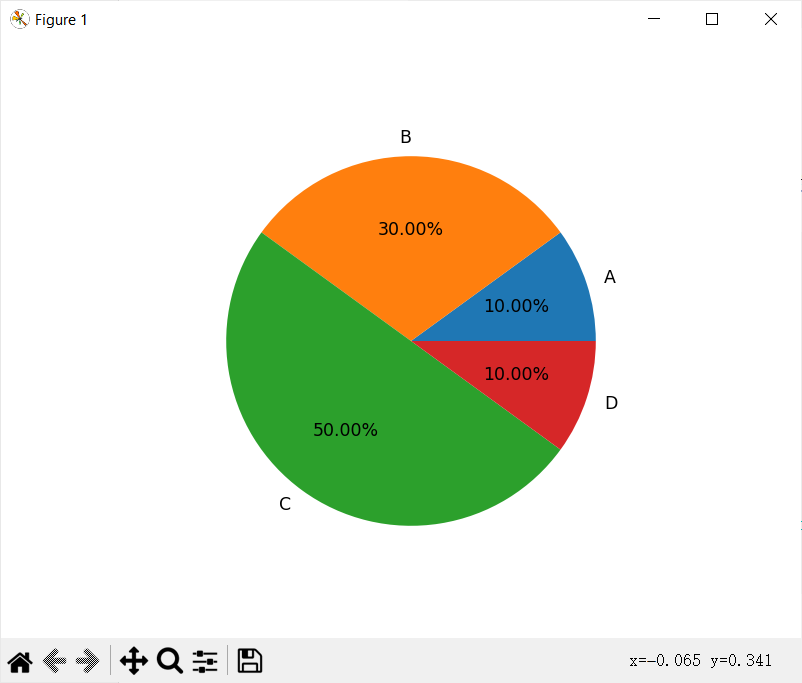
Matplotlib
可以用图形化方式展示数据,图表样式比excel更多,更专业。
更多图表样式在官网https://matplotlib.org/stable/gallery/index,下载后替换数据即可。
1 | import matplotlib.pyplot as plt |
运行结果: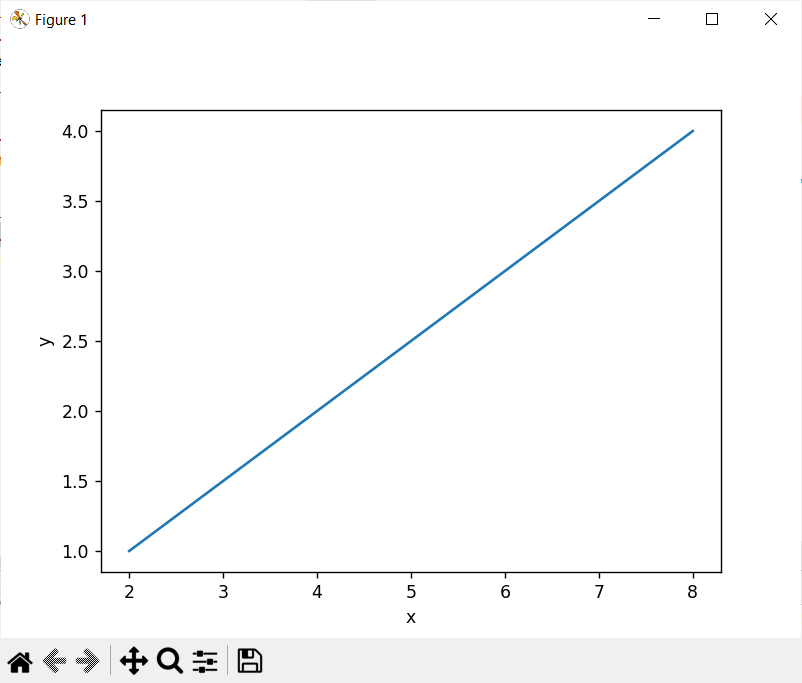
Scipy高级科学计算库和scikit-learn机器学习库
scikit-learn安装:
(1) pip uninstall numpy
pip install numpy==1.19.0 -i http://mirrors.aliyun.com/pypi/simple/ –trusted-host mirrors.aliyun.com
(2) 将Installer.zip拷贝至如下目录并解压缩 C:\Program Files (x86)\Microsoft Visual Studio
(3)pip install scipy==1.5.1 -i http://mirrors.aliyun.com/pypi/simple/ –trusted-host mirrors.aliyun.com
(4)pip install scikit-learn==0.23.1 -i http://mirrors.aliyun.com/pypi/simple/ –trusted-host mirrors.aliyun.com
大写X表示数据,小写y表示label/target。后面加后缀表示训练或测试数据。
预测模型
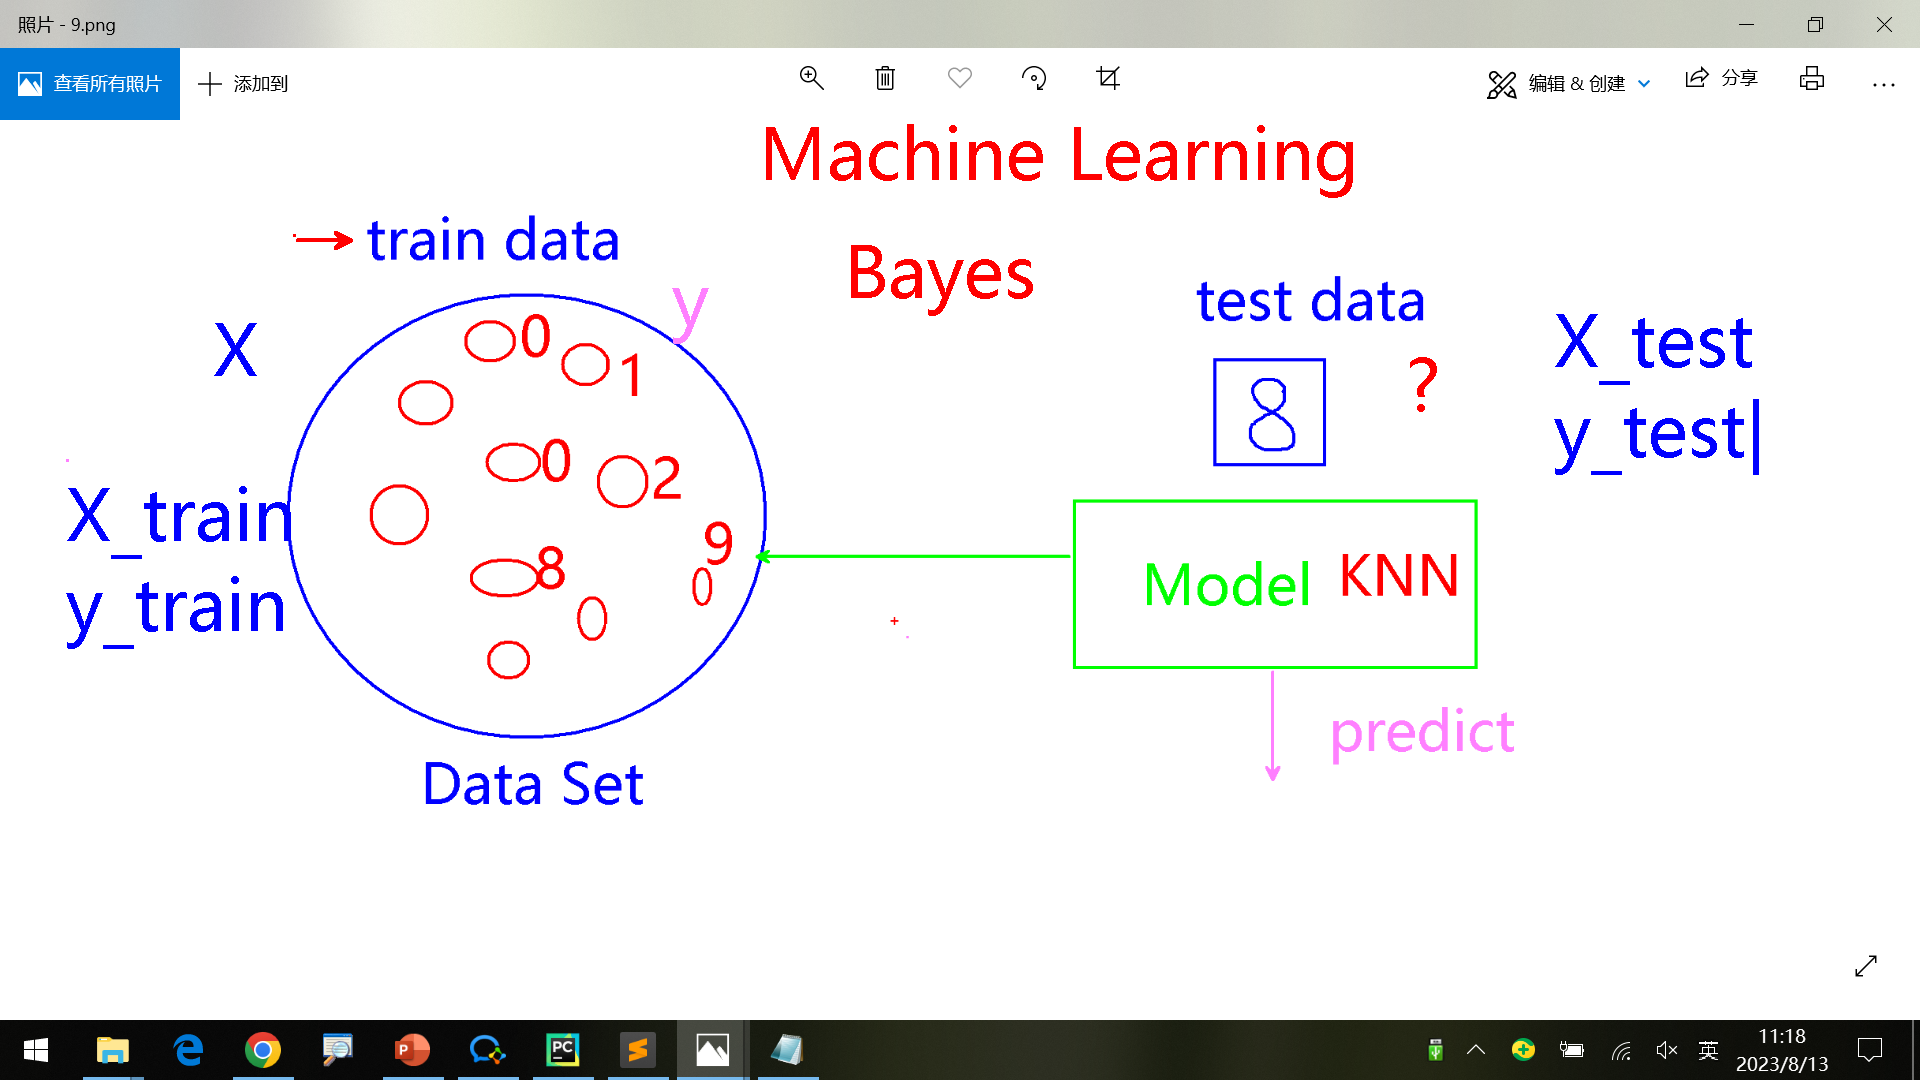
从数据中学习,然后给测试数据,根据之前训练的数据,预测/匹配最类似的一个label作为结果。
下面是学习手写数字,然后根据给定的test_data进行匹配,预测是哪个数据;这里采用KNN算法。
1 | from sklearn import datasets |
评估模型
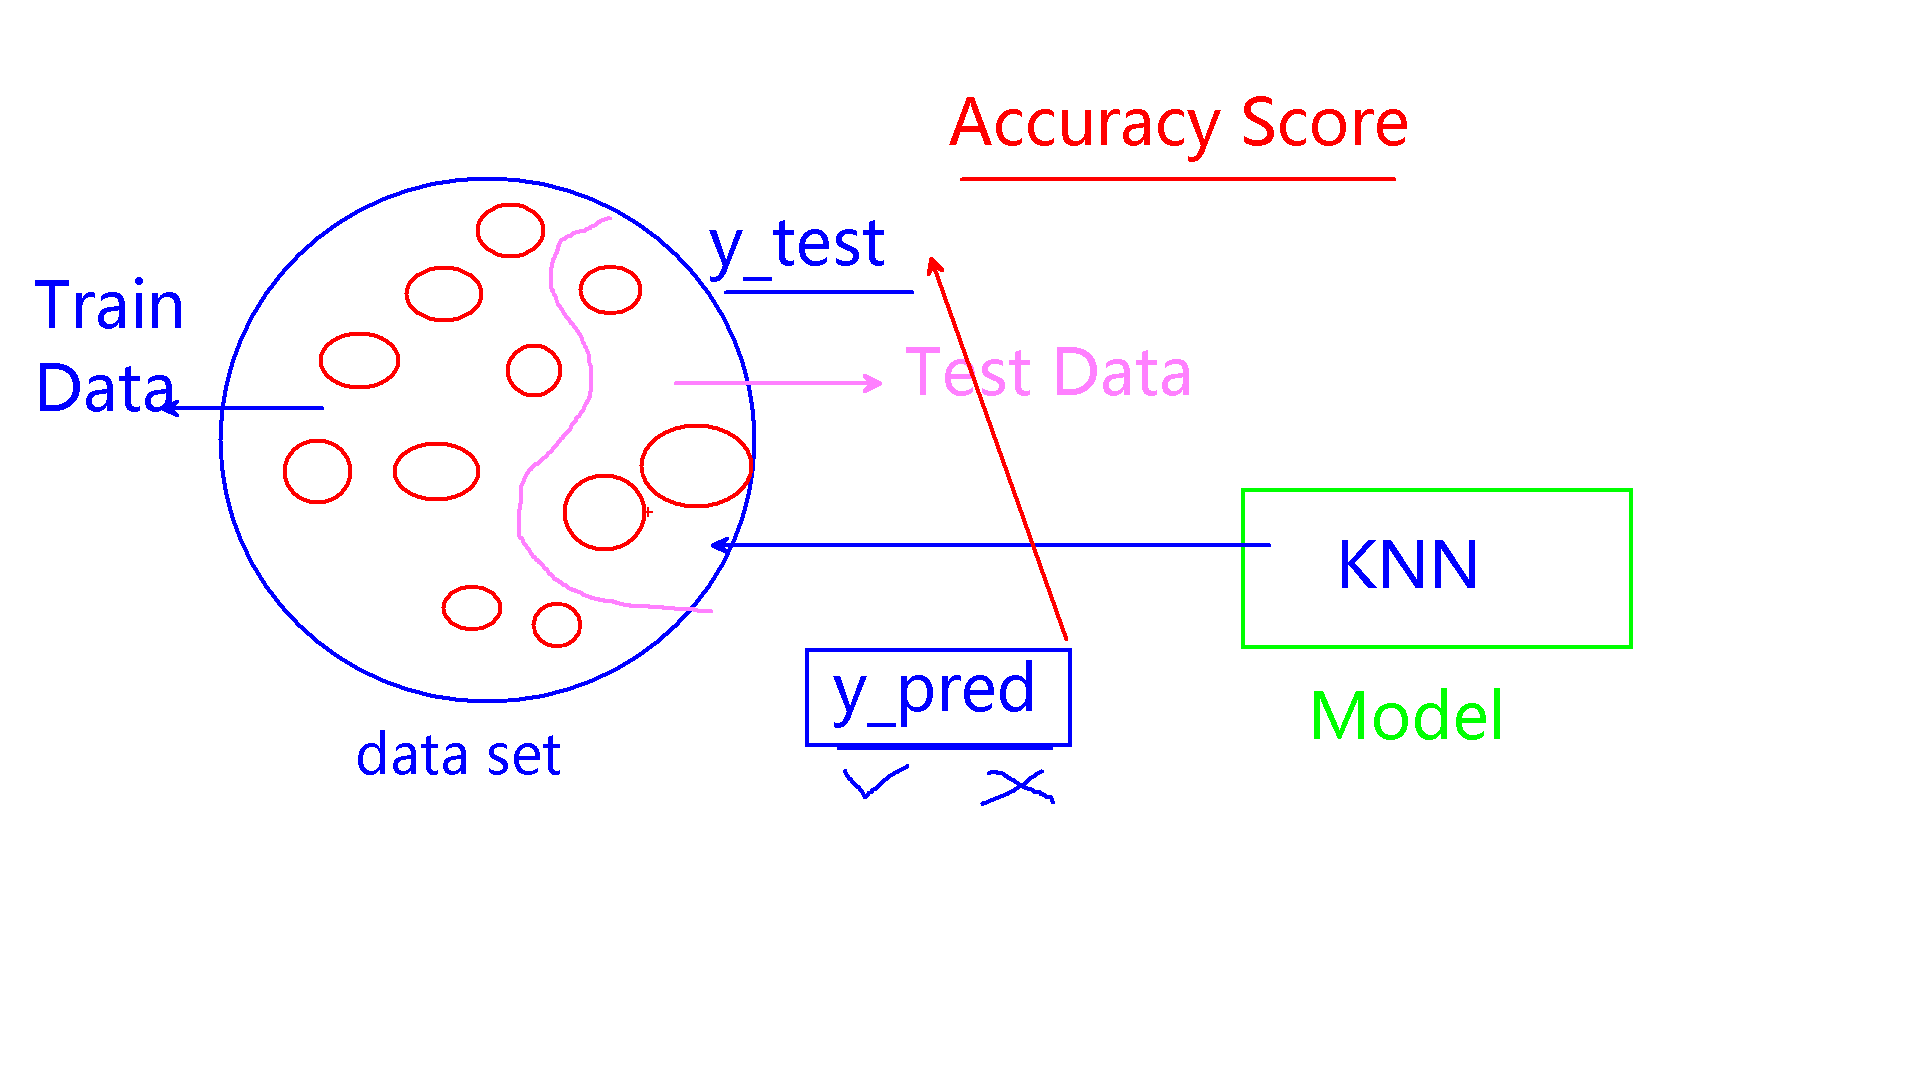
数据集中数据分为2部分,大量数据用于训练,少量数据用于测试。最后比较测试数据的正确结果和实际结果,作为accuracy score
1 | from sklearn import datasets |
应用实例
对糖尿病数据’pima-indians-diabetes.csv’应用上述模型
1 | import pandas as pd |
输出结果
1 | [0] |
表示预测模型评估结果为:没有患糖尿病;评估模型得到的准确率为0.56(每次随机选取数据,所以结果也不同)。
为了得到更高的准确率,可以对算法参数进行调整:
1 | dtc = DecisionTreeClassifier(criterion="entropy",max_depth=2) |
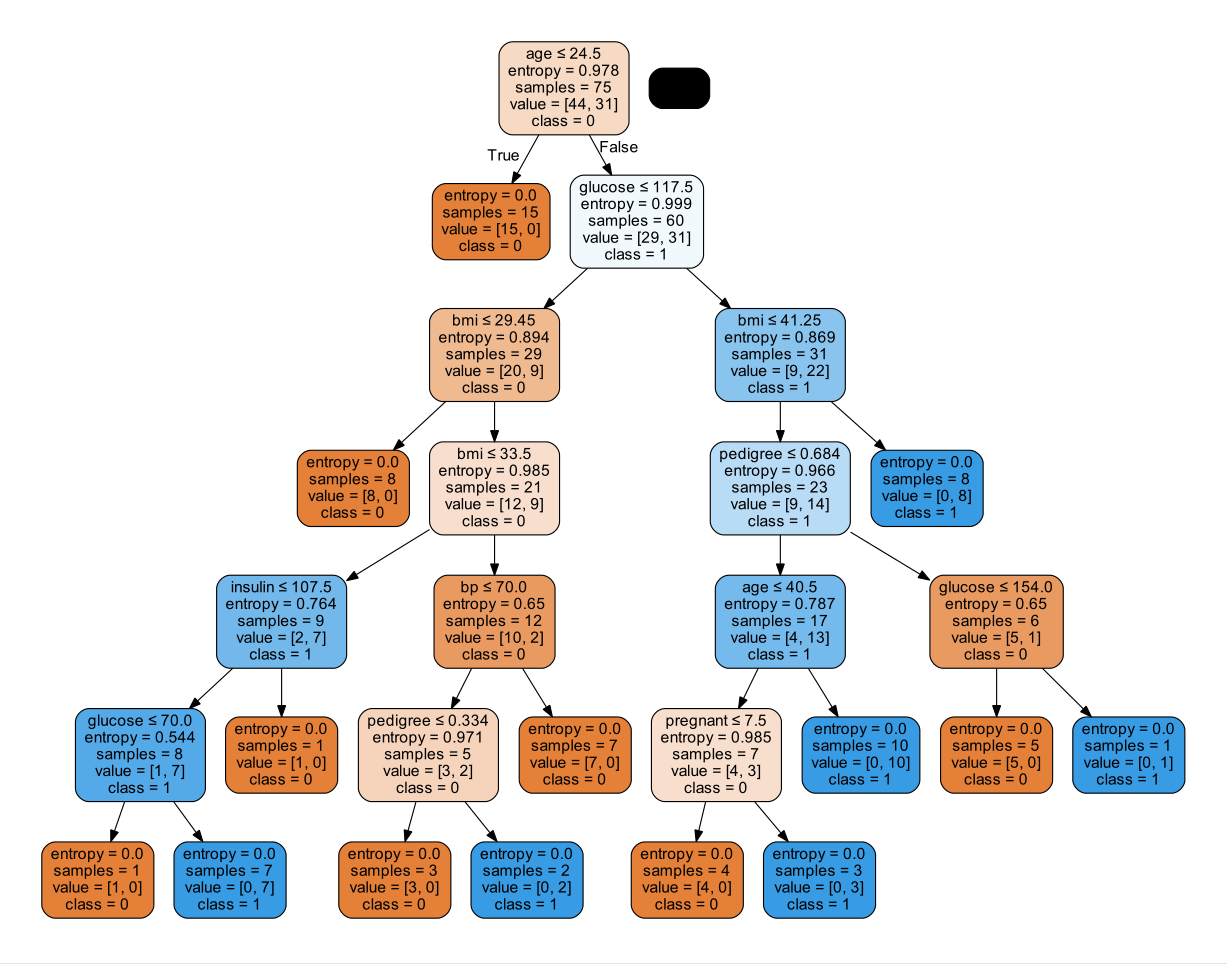
决策树
调参效率太低,为了了解决策树,可以用图形化工具输出每一步的图像。
- 安装pydotplus
pip install pydotplus - 下载graphviz并设置环境变量,这里安装2.38版本
1
2
3
4
5
6
7
8
9
10
11
12
13
14
15
16
17
18
19
20
21
22
23
24
25
26
27
28
29
30
31
32
33
34
35
36
37
38
39
40
41
42
43
44
45
46
47
48
49
50
51
52
53import pandas as pd
from sklearn.metrics import accuracy_score
from sklearn.model_selection import train_test_split
from sklearn.tree import DecisionTreeClassifier, export_graphviz
import numpy as np
import pydotplus
from six import StringIO
class DiabetesPredict(object):
def diabetes_predict(self):
data_set = pd.read_csv('pima-indians-diabetes.csv')
feature_columns = ['pregnant', 'glucose', 'bp', 'skin', 'insulin', 'bmi', 'pedigree', 'age']
X = data_set[feature_columns]
y = data_set.label
dtc = DecisionTreeClassifier()
dtc.fit(X.values, y.values) # 加上.values
test_data = [1, 97, 66, 15, 140, 23.2, 0.487, 32]
y_pred = dtc.predict(np.array(test_data).reshape(1, -1))
print(y_pred)
def diabetes_identify(self):
data_set = pd.read_csv('pima-indians-diabetes.csv')
feature_columns = ['pregnant', 'glucose', 'bp', 'skin', 'insulin', 'bmi', 'pedigree', 'age']
X = data_set[feature_columns]
y = data_set.label
X_train, X_test, y_train, y_test = train_test_split(X,y, test_size=0.25)
dtc = DecisionTreeClassifier(criterion="entropy",max_depth=2)
dtc.fit(X_train.values, y_train.values) # x.values will have only values without headers
y_pred = dtc.predict(np.array(X_test))
print(accuracy_score(y_test,y_pred))
# Generate graph
dot_data = StringIO()
export_graphviz(dtc,out_file=dot_data,
feature_names=feature_columns,
class_names=['0','1'],
filled=True,
rounded=True,
special_characters=True)
graph = pydotplus.graph_from_dot_data(dot_data.getvalue())
graph.write_pdf('decision_tree.pdf')
if __name__ == "__main__":
dp = DiabetesPredict()
dp.diabetes_predict()
dp.diabetes_identify()
运行后本地decision_tree.pdf文件: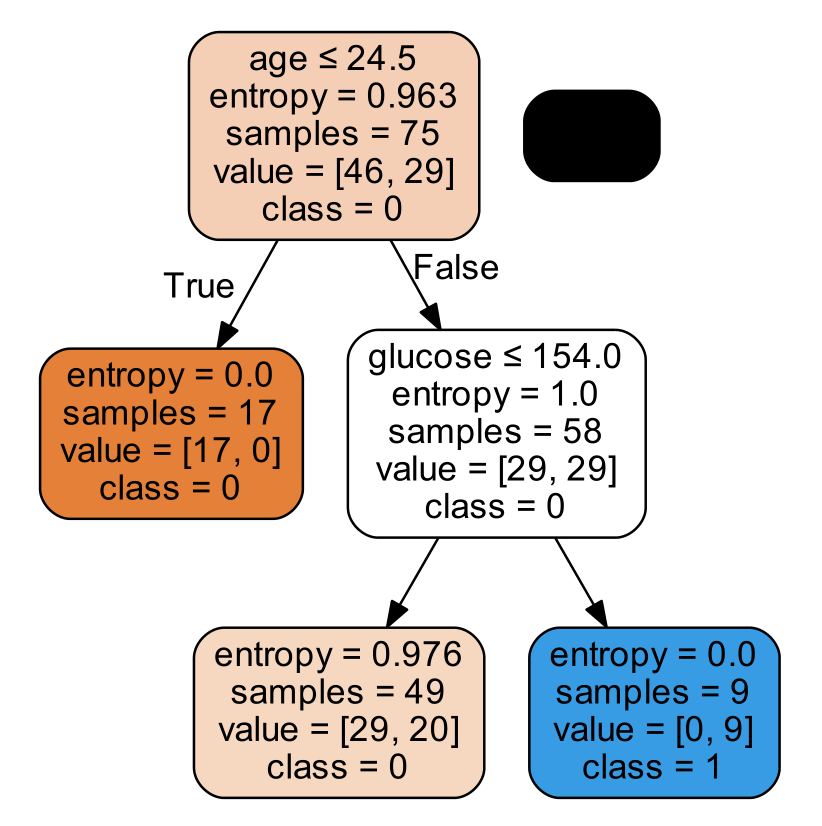
修改为:
1 | dtc = DecisionTreeClassifier(criterion="entropy") |
运行后本地decision_tree.pdf文件: